Devops has already established itself as a must have practice/team/department in every IT company everywhere. As the enthusiastic dev ops engineers introduce tool after tool to automate the journey from commit to production, following incident can occur in your company.
John is the project manager and he is interested in the project status. Devops has made it possible for him to get a very clear picture without leaving his desktop. Git will show how many commits have happened & who did them. Sonarqube will give an idea about the code quality. Bamboo/Jenkins will tell him the build status. Octopus will tell him about deployment & release status in every staging environment.
John spends his entire morning logging into all the systems and ends up without a clear picture of what is going on and pulling his hair in frustration. John is having an information overload, he doesn’t need 80% of what these multiple tools present to him.
Situation is even worse with Mary, John’s boss. She is a senior executive who oversees multiple projects and she would like to see the status of all these in one compact nice report.
Hygieia is an opensource tool that can help the situation. It will talk to multiple devops tools and present a clear picture which is a timesaver for the team and a lifesaver for the managers. It provides a single, configurable, easy to use dashboard to visualize near real-time status of the entire delivery pipeline.
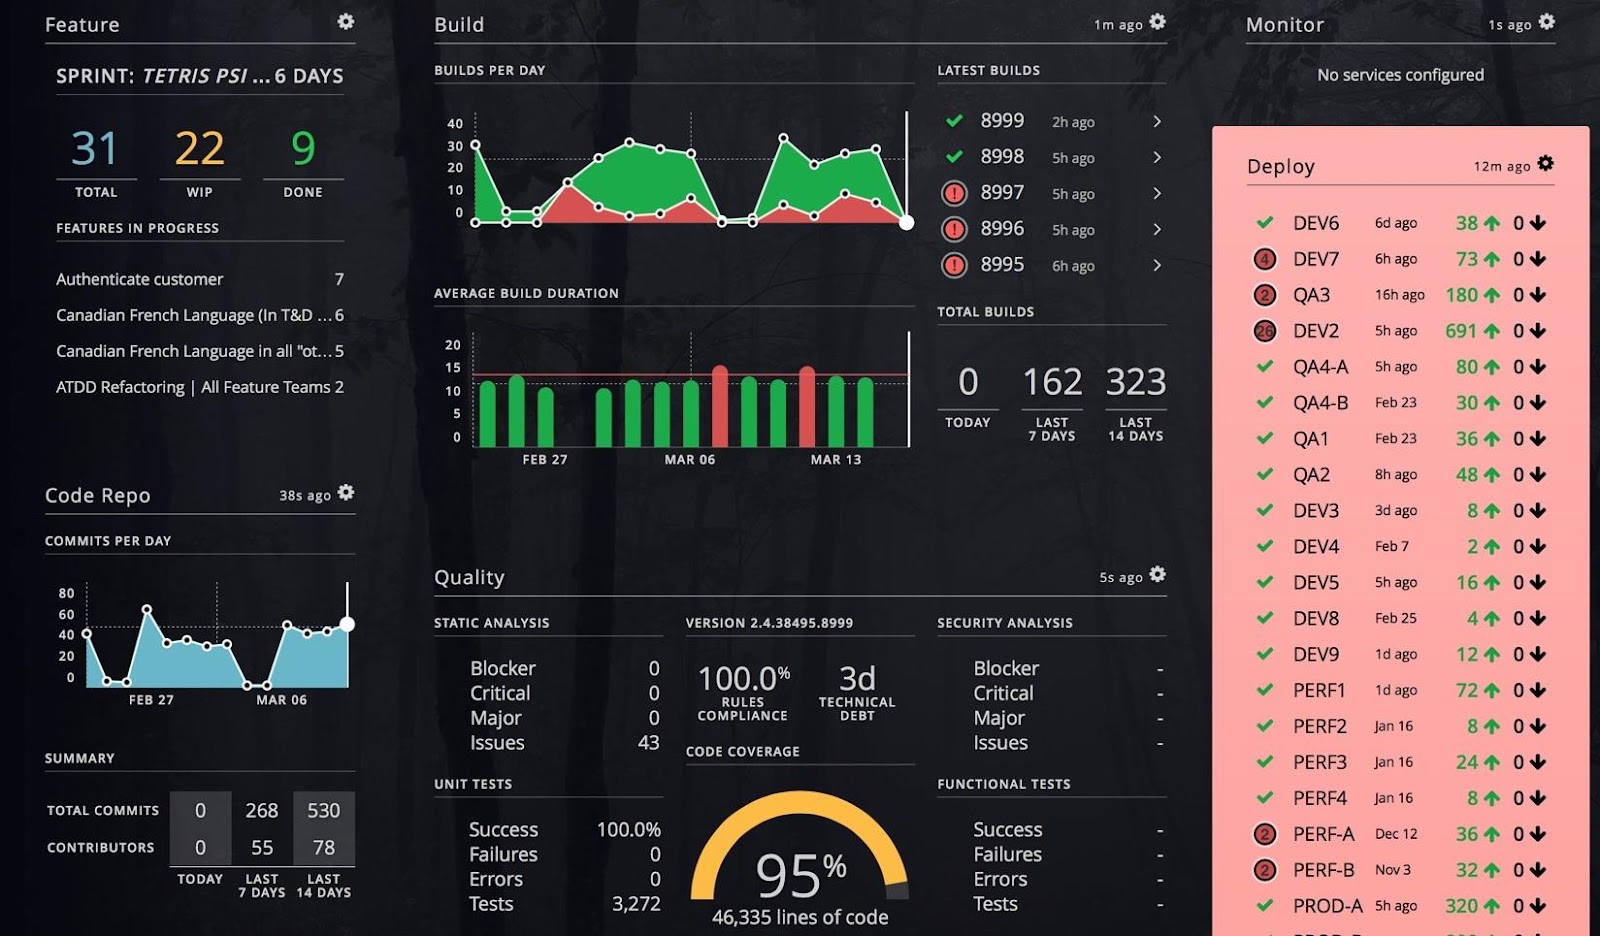
Widget View of the team dashboard displays widgets for multiple devops tools with summarized stats and graphs etc for a given software project.
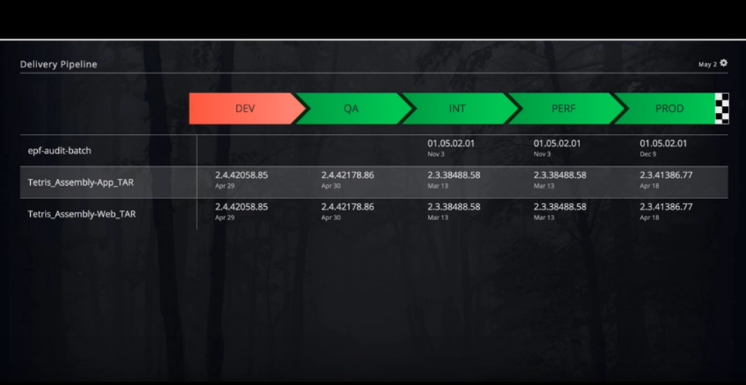
Pipeline View of team dashboard showcases code progression through each component’s lifecycle in the software delivery process, from initial development to the final, product deployment. In other words this is how the deployments across various staging environments look like.
Product Dashboard
Product dashboard shows multiple components’ lifecycle progression for a product through the development stages. It displays multiple applications in a single illustration. Here, you see the progression of an application from its inception (commit) to its final release (prod) for multiple teams. Product dashboard can be considered as multiple team dashboards aggregated & summarized to provide one view.

Architecture

Hygieia makes use of microservices. There is a dedicated service called Collector for each DevOps tool. A collector collects data from the DevOps tool and save that data into the MongoDB. Collectors are available for many popular devops tools. You can also create your own custom collector if there is no collector available for a devops tool you need to integrate to Hygieia.

1. Install & Configure DevOps Tools in Hygiea Dashboard
2. Collectors will collect the data from DevOps tool based on the configuration
3. Collector will convert the collected data into MongoDB data format
4. Saves the converted data into MongoDB Collector
5. UI calls the RestAPI to get Data from Database
6. RestAPI get the data from database and returns to UI
7. UI will Displays the collected data in the Dashboard
Executive Dashboard
Remember Mary, the senior executive. She would be happy to see some key KPIs related to all the projects she is overseeing. (deployment frequency, lead time, failure rate, time to recovery etc) Hygieia Executive dashboard does just that. It’s a recent project by Hygieia team that leverages component and product information from team and product dashboards, aggregates them into KPI metrics, and provides a visual representation which is meaningful at an executive (portfolio) level. It is designed to display information for a combination of portfolios, products, & components.
